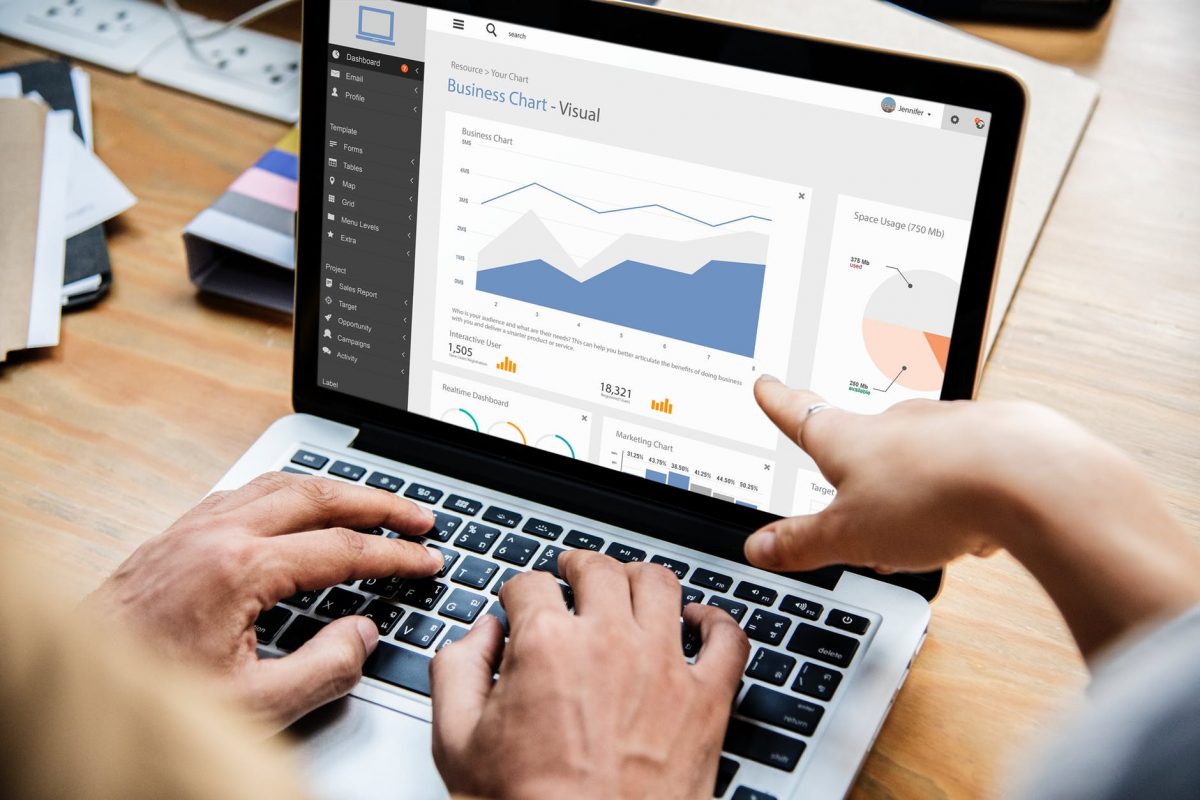
With the right data analysis tools, the business decisions you make will have a higher probability of bringing you meaningful results.
The idea is simple…
Since the tools show you crucial data about the important aspects of your business, you can predict (to some extent) the impact of your decisions.
What’s more, since the numbers don’t lie, you’ll have an accurate view of how your business is performing, instead of basing your decisions on gut feel.
That bit is crucial especially for businesses that are running omnichannel or multichannel marketing campaigns. Because they produce massive amounts of data from varying platforms, it becomes almost impossible for them to track and monitor their campaigns.
However, with the right data analysis tools, you’d be able to gather, interact with, visualize, explore, and merge your data from multiple sources.
To help you find the right software and apps to work with, let me share with you these data analysis tools for small businesses.
Looker
There are loads of value that you can get from your data.
However, the challenging part isn’t knowing whether or not your data has value, but it’s learning how to extract and refine your data to get the insights that you want.
With tools like Looker, you can explore, capture, and analyze data from various sources to help you make data-based decisions for your business.
The tool offers features that let you interpret customer behavior, analyze supply chains, evaluate distribution processes, quantify customer value, and market digitally.
With the tool’s chart types, customization options, and visualization blocks, you can communicate your data insights quicker and more clearly.
For instance, if you want to analyze typical demographic metrics such as age, gender, and income, you can use the tool’s Demographic Data Block visualization feature.
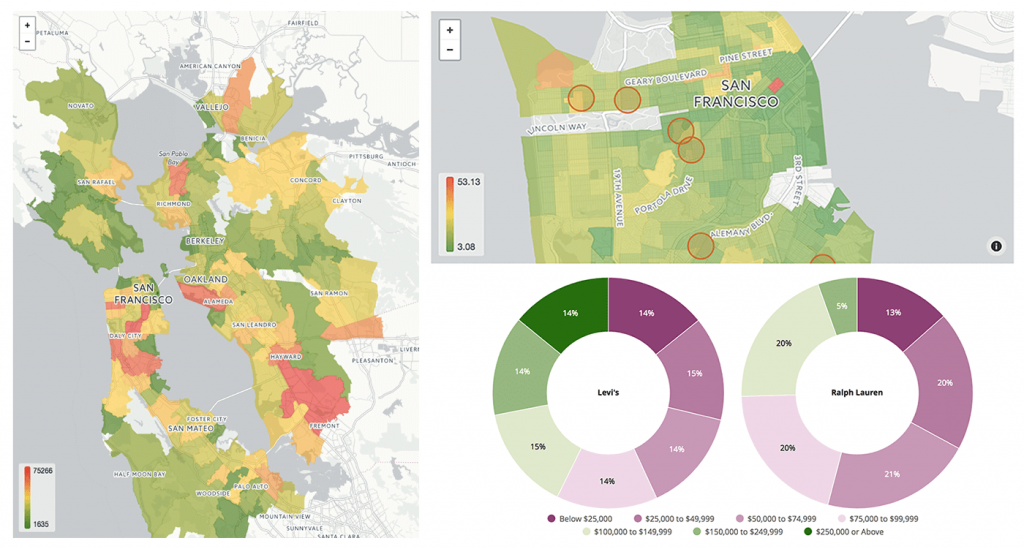
Among its many features, the tool also offers enhanced data analyst tools and custom fields for validation, foldering, and git branching to speed up your data modeling.
With a scalable and flexible platform like Looker and the features it offers, you can extract the value of your data in a faster time-to-value manner.
ClicData
Making valuable business decisions is crucial for your business to succeed, and those decisions should be made based on data analysis.
It’s like when you want to achieve a goal. You need valuable data to succeed, and that’s why it’s important to research before starting a new project.
By having a business dashboard software, you’ll have quick access to valuable information and useful numbers to help you perform accurate business analyses.
This is where business intelligence dashboard solutions like ClicData come in handy.
The tool – used mainly by mid-sized and small businesses – allows you to create your reports and dashboards.
With its drag-and-drop interface, you can easily connect to data that is stored both in the cloud and on location.
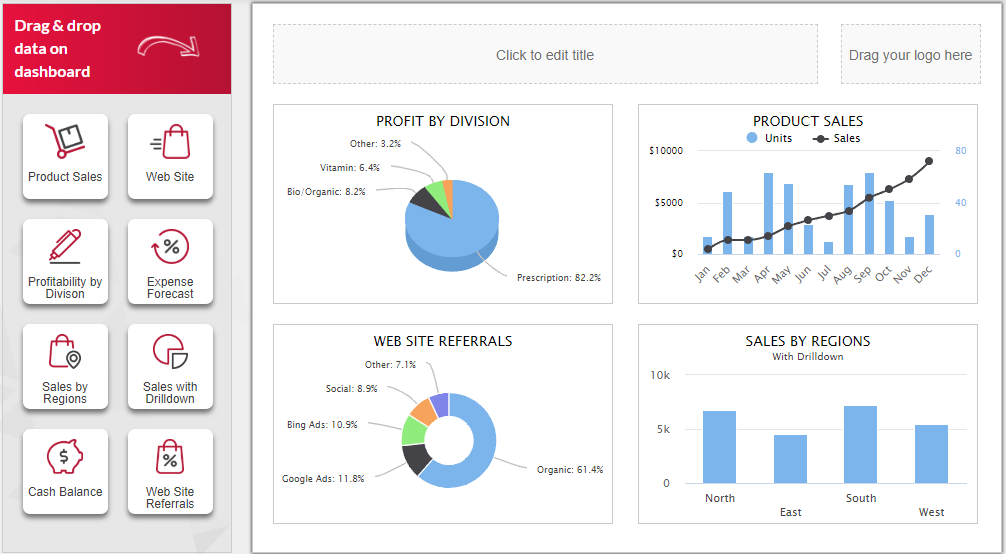
Image Source: ClicData
Aside from helping you create interactive and data-rich dashboards, the tool also powers data history management, automated transformation and merging of data, and data processing tasks, making data centralization and management easier.
The dashboard solution features that ClicData offers can provide you the efficiency and usability that you need to get an overall real-time view of your data analysis and insights.
Domo
Your valuable business data is stored in multiple systems and it will be challenging to get them all in one location.
When you use cloud-based business management platforms such as Domo, you can combine and connect your data from all your systems and quickly gain actionable insights.
Suitable for small scale to large businesses, the platform integrates with various data sources, including databases, social media, spreadsheets, and any on-premise or cloud-based software solution.
Here are some of the features that Domo offers to help you merge your data from multiple sources and get the insights you need.
- Connect your data. The platform will act as a hub by letting you merge, link, and access your data between your systems. It will also update your data automatically, so you don’t need to regularly sync and update.
- Store Data. With the platform’s intelligent data warehouse, you can get real-time insights and visualizations that are tailored to each user’s needs, which can be accessed from any device.
- Prepare data. Domo offers a drag-and-drop Magic ETL (Extract, Transform, and Load and DataFusions that make it easy for you to transform and combine data sources, without the need for coding experience.
- Predictive analytics. Mr. Roboto, the Domo AI engine, offers advanced alerts and predictive analytics to help you stay ahead of your business.
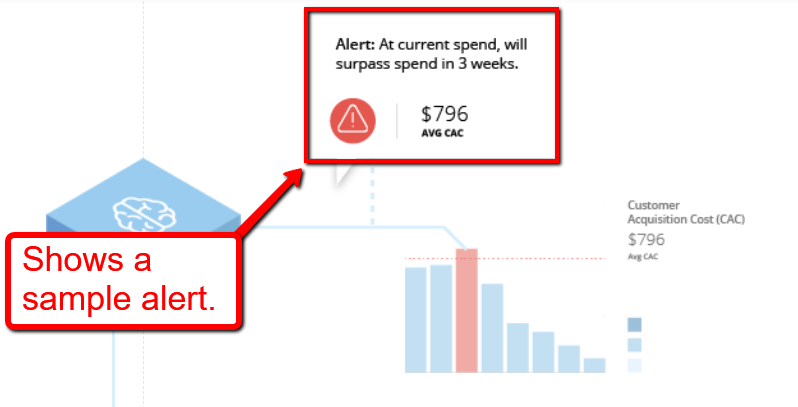
Image Source: Domo
You can set up your custom notifications to alert you when your KPIs surpass your threshold.
Plus, you can use the data science functions to prepare your data and create predictive models, even if you’re not a data scientist.
R Programming Language
Your data needs to be translated into useful insights for you to harness its power and value for your business, and to help you do that; you need to “speak” its language.
There are tons of programming languages available for data science, but one of the most popular tools for graphics and statistical computing is R.
R is a free programming language and software that you can use in data analysis to help retrieve, clean, analyze, and visualize your data, and predict outcomes.
The tool offers several techniques such as linear and nonlinear modeling, clustering and classification techniques, time-series analysis, and other graphical techniques
With its easy-to-use interface and expressive syntax, you can create functions, packages, and objects.
Plus, you can use it to produce well-designed plots, mathematical formulas. It even has machine learning algorithms that are crucial for the application of predictive modeling for your business.
With all that said, learning R isn’t as intimidating as you would think.
For instance, you can get the mean of the age and the median of the height from your dataset by typing in mean(Age) and median(Height).

You can also plot the age and height using hist(Age) or hist(Height) and get a histogram of the data.
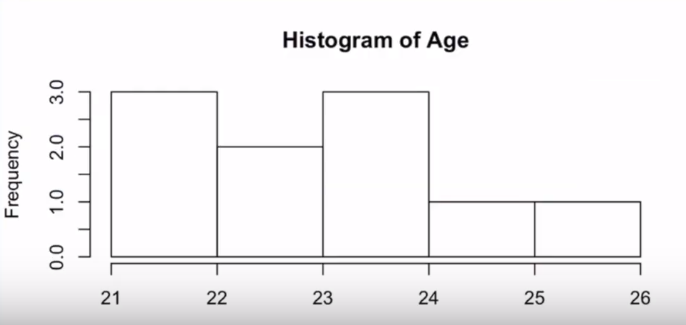
Using R makes writing code to help analyze your data easier and less time-consuming. The language is also extensible and adaptable, plus, it supports various graphical techniques.
If you want to dive deeper into data analysis, you can enroll in a data analytics course in NYC and learn the R programming language. It’s a great step towards expanding your data science knowledge and skills.
Final Thoughts
There is value in your data, and with the right set of data analysis tools, you can harness the power of your data, and gain actionable and useful insights to improve your business processes and make data-driven decisions.
Give these tools a try and see how they address your data analysis needs.
Is this information useful? Please share it with your network. Cheers!
