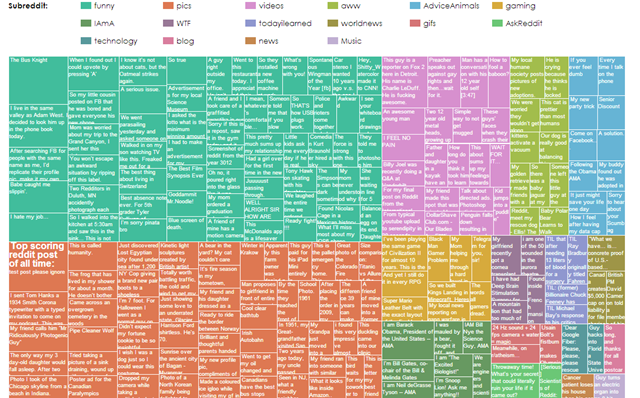
Fortunately, our weekend will not go wasted this time around as we all have a very interesting thing to visualize. Owing to popularity of Reddit, the top-scoring posts have been presented as an interactive color-coded chart. You can analyze the posts deeply for your interest and information. If you are a Reddit lover, this is simply the best interactive source of knowledge for you. The presentation of all the data is very much concise and to the point. Perhaps, it will take some hours to get deep insight into it but it is worth diving in.
There have been plenty of posts on Reddit since it was founded. Some have been very good and competing for the high ranking. Based on the popularity and comments, scores have been assigned to posts which decide their ranking. The visualization shows the top-rated 200 posts on Reddit of all times.
This visualization represents the tree map i.e. the whole area has been subdivided into various rectangles. Area of each rectangle represents rating of the post. There is provision of checking the score as well as the comments made on the post.
The top-rated posts have been subdivided into various sub-categories for example funny, technology, blog and news etc. This visualization shows color coding for each post. The trend of posts can easily be determined by simple visual inspection of chart.
The overall rating of posts depends upon difference between up votes and down votes. For example, the second top-rated post of all time in terms of voting, “The Bus Knight”, got more than 21000 upvotes. However, it falls short in comments as compared to other popular posts as “I am Barack Obama, President of the United States”. Deep analysis of chart shows that sub-reddits of ‘pics’ and ‘funny’ dominate the top 200 posts.
There is provision of visualizing the chart with posts arranged according to the number of comments made. It provides an excellent data exploring opportunity for Reddit lovers. No need to put strain on your eyes as interactive version of this visualization provides all the minor details. Click through each posts to analyze its ranking.
This informative visualization has been made by James Trimble, student of Computer Science at University of Glasgow, UK. His exceptional skills have put plethora of Reddit’s secrets in a single place.
